PeoplePulse Analytics
PeoplePulse Analytics is a modern, high-performance HR Intelligence Dashboard built to deliver real-time workforce insights for executives and HR leaders. Designed with visual precision and enterprise-grade responsiveness, it transforms complex HR data into clear, actionable intelligence that supports strategic decision-making and organizational growth.
App Overview
PeoplePulse Analytics provides a centralized command center for monitoring employee metrics, tracking organizational health, and analyzing workforce trends. The platform combines interactive KPI summaries, advanced visual analytics, and dynamic filtering into a seamless user experience optimized for desktop, tablet, and mobile environments.
- Real-time KPI monitoring with interactive metric cards
- Advanced visual analytics including bar, line, donut, histogram, and funnel charts
- Dynamic global filtering by department, employment type, location, and date range
- Responsive grid layout for multi-device accessibility
- Efficient state management for fast data recalculations and updates
Showcasing
Explore the core modules that power PeoplePulse Analytics. Each component is purpose-built to deliver clarity, performance, and actionable HR intelligence.
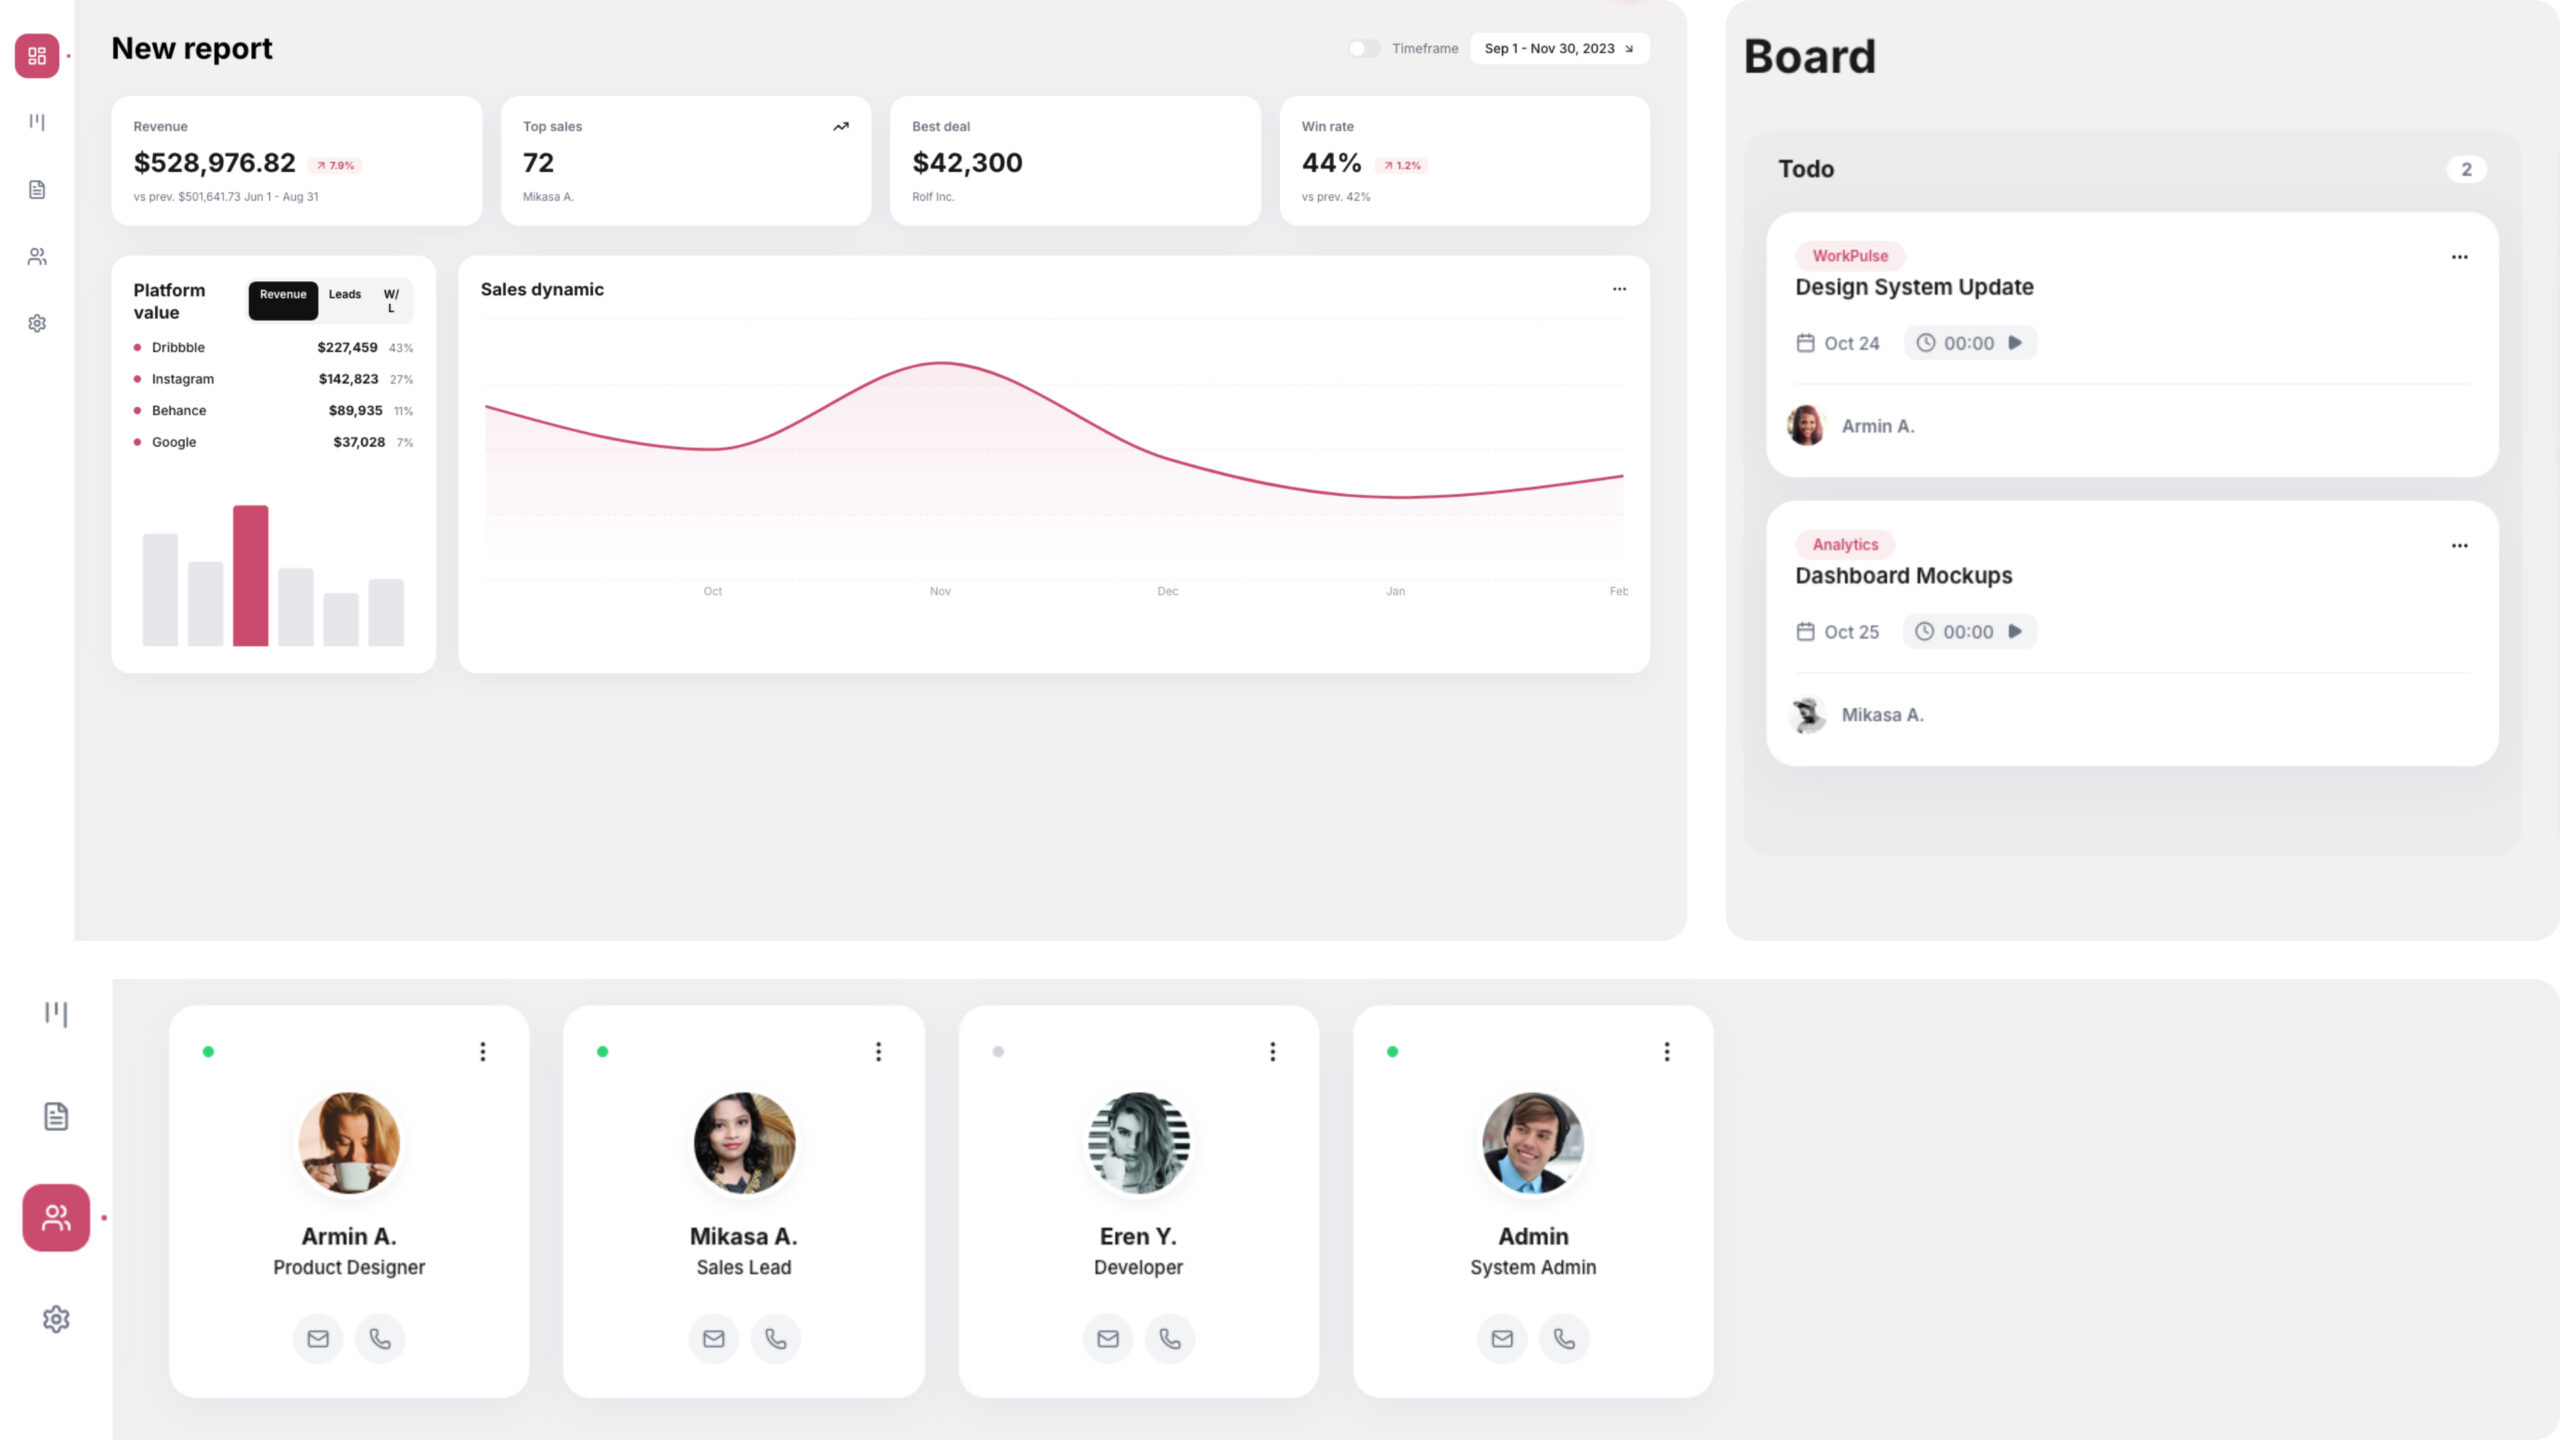
Executive Dashboard
The Executive Dashboard provides a high-level overview of organizational performance through real-time KPI cards and summarized workforce metrics.
- Total Employees and Active Employees tracking
- Turnover rate monitoring with trend indicators
- Average salary insights
- Open positions visibility for recruitment planning
- Instant executive snapshot for quick decision-making
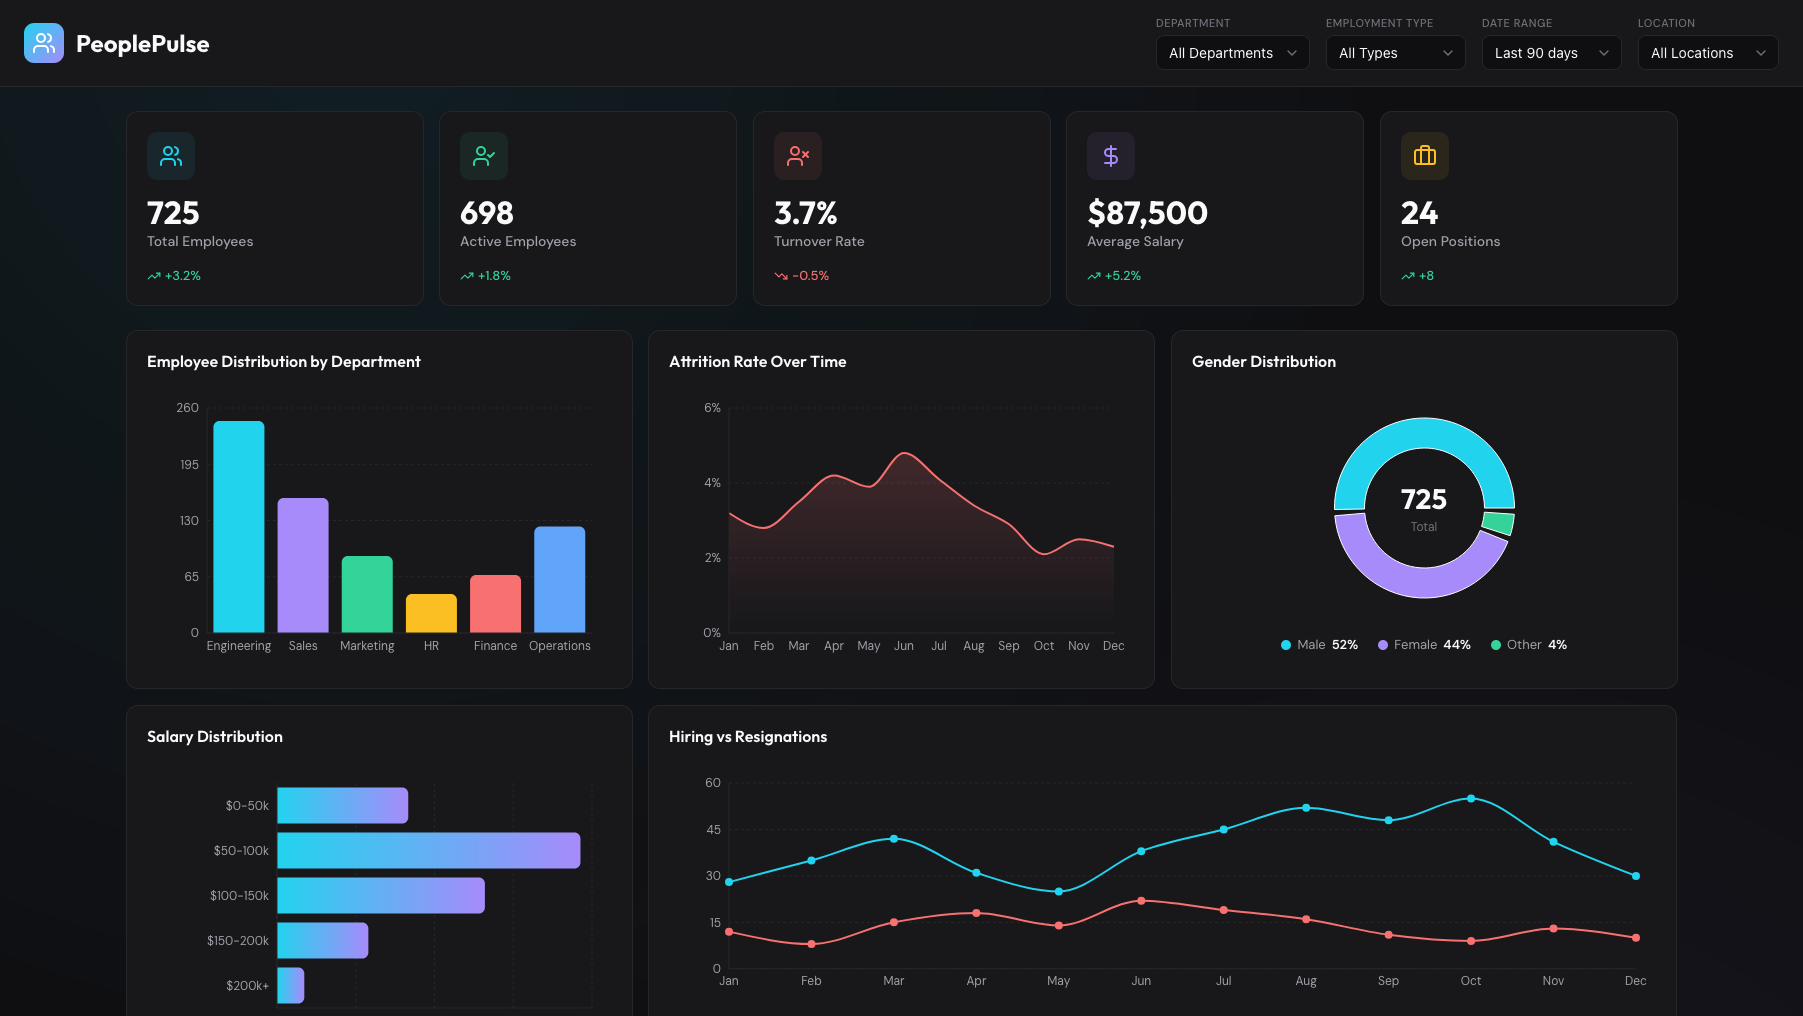
Advanced Analytics Charts
The Analytics module transforms raw HR data into interactive visual insights, enabling deep workforce analysis across multiple dimensions.
- Employee distribution by department using bar charts
- Attrition trends with line and area visualization
- Gender distribution through intuitive donut charts
- Salary distribution via histogram analysis
- Hiring funnel visualization for recruitment pipeline tracking
Dynamic Filtering System
The global filtering system enables users to refine data views instantly, ensuring that all KPIs and visualizations reflect selected criteria in real time.
- Filter by Department for focused workforce analysis
- Employment type segmentation
- Location-based workforce insights
- Date range filtering for trend comparisons
- Automatic data recalculation using optimized state management
Responsive Experience
PeoplePulse Analytics is fully responsive, delivering a seamless experience across all devices without compromising usability or visual integrity.
- Three-column layout on desktop
- Adaptive two-column layout on tablets
- Single-column mobile optimization for readability
- Touch-friendly chart interactions
- Performance-optimized rendering across screen sizes
Data Architecture & Performance
The application uses a modern decoupled architecture to ensure scalability, speed, and maintainability across enterprise deployments.
- React 18 with Vite for optimized builds
- SVG-based chart rendering for high performance
- Efficient state management using memoized data derivations
- Structured component layout for maintainable UI architecture
- Mock JSON data system adaptable to real HR data sources