ExecVision – Executive Business Operations Dashboard
ExecVision is a state-of-the-art executive dashboard engineered to deliver a strategic, high-level overview of company performance within a single immersive interface. Designed for speed, clarity, and visual precision, it empowers decision-makers with real-time insights into revenue, operational costs, profitability, and efficiency across business units and fiscal periods.
App Overview
ExecVision transforms complex operational data into clear, interactive visual intelligence tailored for executive leadership. By combining dynamic filtering, KPI monitoring, and advanced trend visualization, it enables rapid performance assessment and strategic alignment across the organization.
- Dynamic filtering by Fiscal Year and Business Unit
- Comprehensive KPI cards with trend indicators and comparison modes
- Interactive trend, cost segmentation, and regional performance charts
- Automated strategic insights highlighting key performance changes
- Reactive state management for instant dashboard-wide updates
Showcasing
The following sections outline the core modules of ExecVision, demonstrating how each component contributes to delivering executive-level clarity and operational insight.
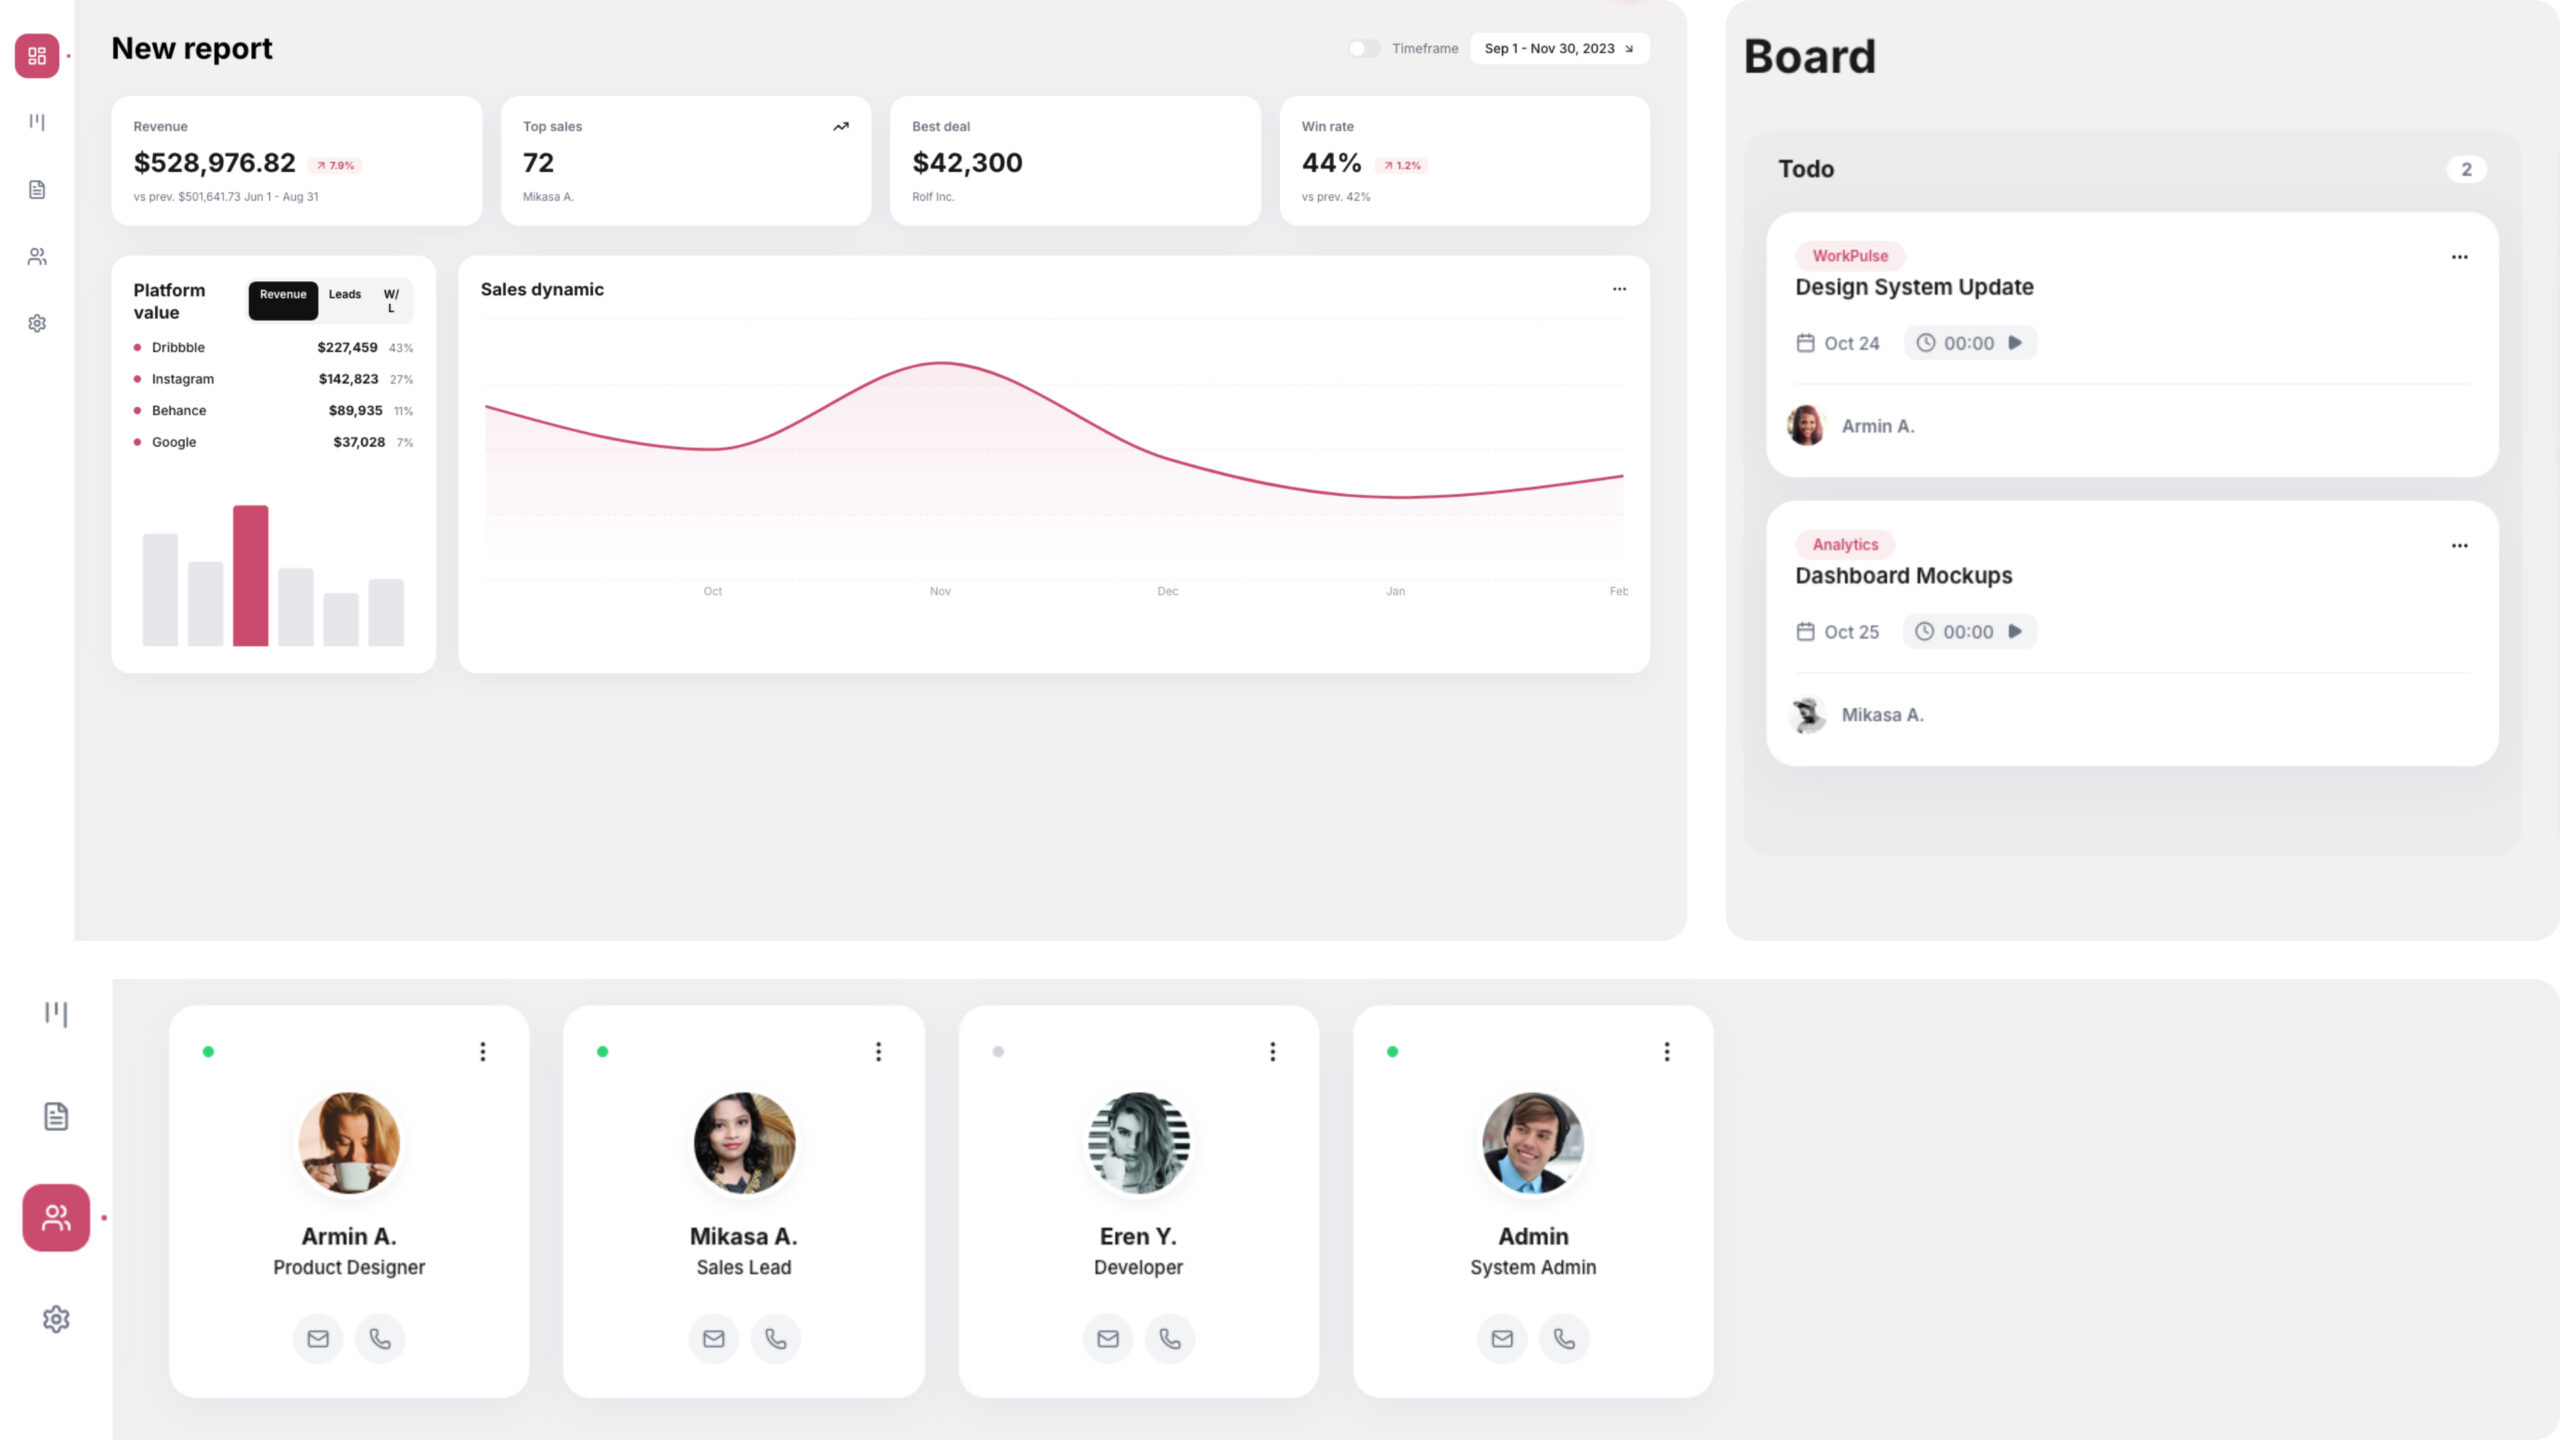
Executive Dashboard
The main dashboard presents a unified strategic overview, consolidating high-impact metrics and visual summaries into a single, refined interface built for executive review.
- Global filter bar for Fiscal Year and Business Unit selection
- Clean layout optimized for fast data interpretation
- Responsive glassmorphic UI elements with smooth entry animations
- Centralized orchestration via App.tsx layout wrapper
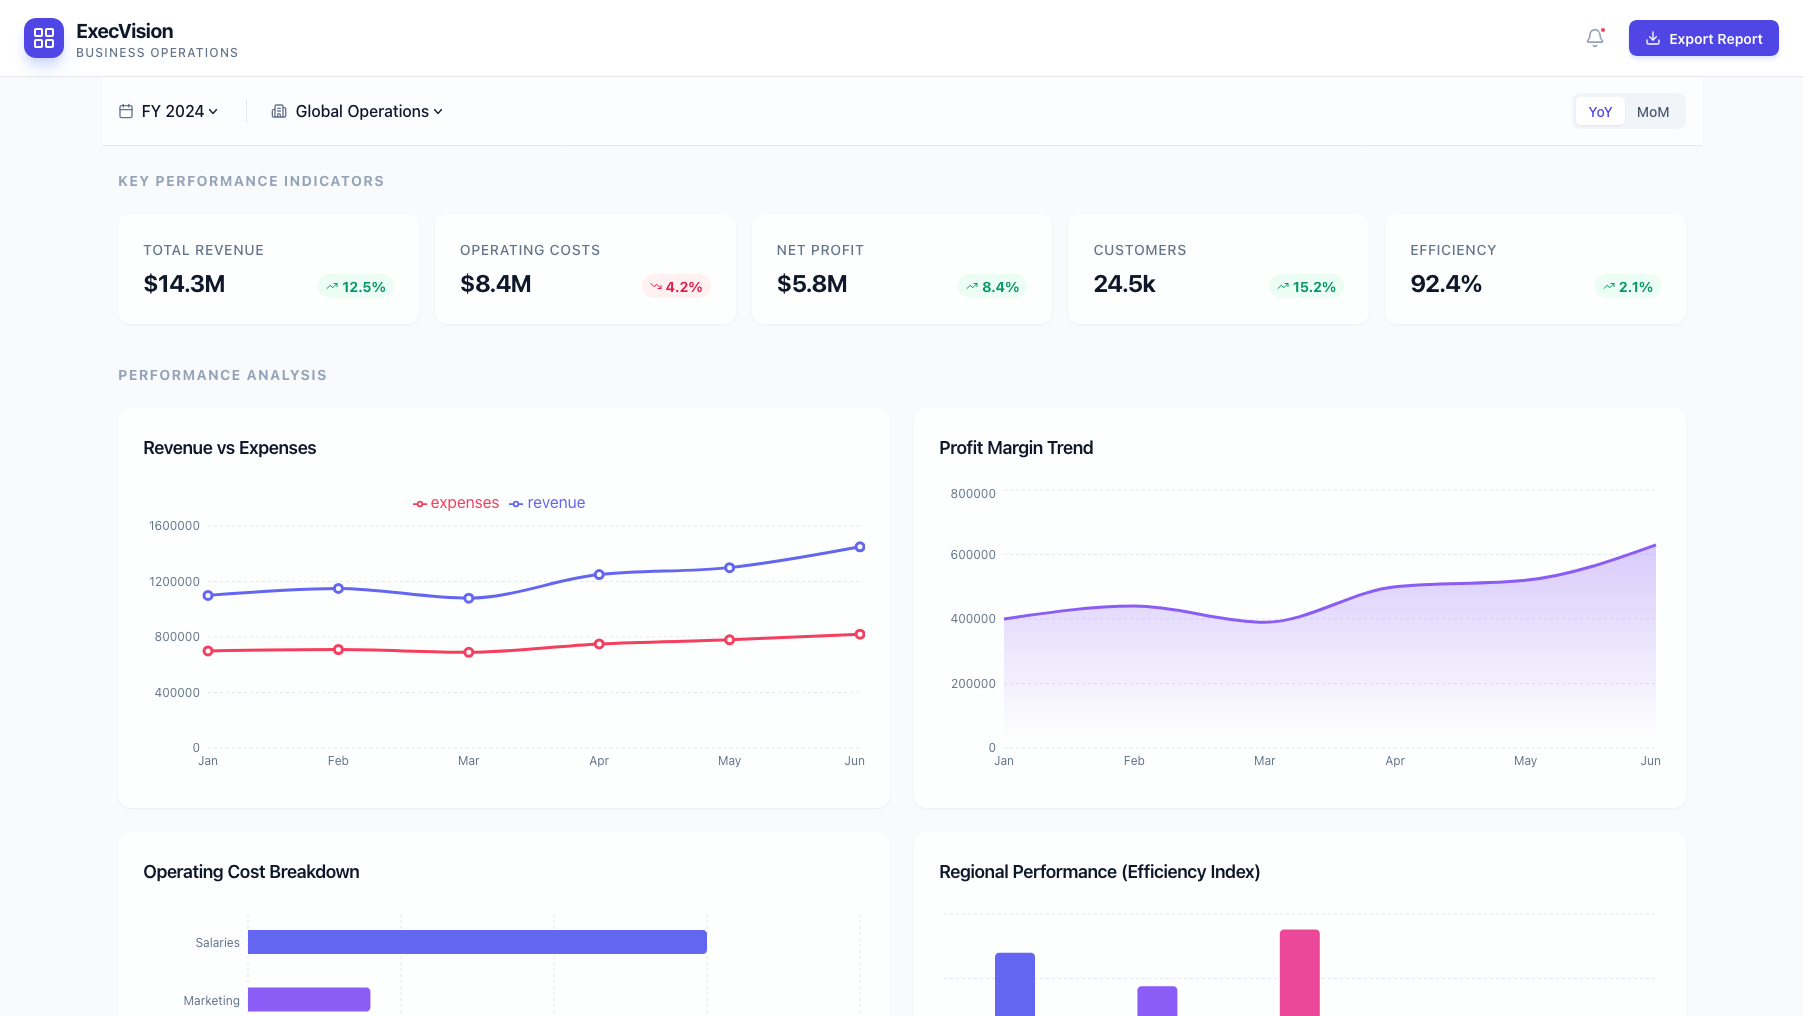
KPI Summary Cards
KPI cards provide real-time tracking of mission-critical metrics, including trend comparisons across different time perspectives such as Year-over-Year and Month-over-Month.
- Revenue, Operating Costs, Net Profit, Customer Growth, and Efficiency metrics
- Dynamic comparison modes (YoY and MoM)
- Trend indicators with calculated performance deltas
- Instant re-rendering through Zustand-powered state updates
Trend & Performance Analytics
The analytics module visualizes historical and comparative performance using interactive, scalable charts designed for executive-level analysis.
- Line and area charts for historical revenue and cost trends
- Dynamic axis scaling based on filtered data ranges
- Hover tooltips with precise data point values
- Responsive SVG-based rendering using Recharts
Cost Segmentation & Regional Performance
This module breaks down operating expenses and efficiency indices across departments and global regions, providing granular insight into operational structure.
- Detailed cost segmentation by category
- Regional efficiency index comparisons
- Business unit performance breakdowns
- Interactive filtering synchronized across all visual components
Strategic Insights Engine
The insights panel automatically generates contextual observations based on selected filters and comparison modes, helping executives identify trends and anomalies instantly.
- Automated detection of significant performance shifts
- Context-aware textual summaries
- Integration with global state for synchronized updates
- Centralized dashboard context via useDashboardStore
Architecture & Technology
ExecVision is built on a modern, reactive architecture designed for scalability, maintainability, and high performance in enterprise environments.
- React with TypeScript for type-safe component development
- Tailwind CSS enterprise design system with glassmorphic styling
- Zustand for lightweight global state management
- Recharts for responsive and interactive data visualization
- Lucide React icons and custom animation keyframes