SalesScope
SalesScope, single-page analytics solution designed to deliver a comprehensive, real-time view of company sales performance. Built with a modern, high-performance UI and interactive data visualizations, it empowers stakeholders to monitor KPIs, analyze trends, and make data-driven decisions with clarity and speed.
App Overview
SalesScope provides a centralized analytics environment where users can explore sales data across regions, product categories, and time periods. By combining high-level KPI metrics with detailed visual breakdowns, the dashboard transforms raw data into actionable business intelligence through dynamic filtering and interactive charts.
- Comprehensive KPI monitoring including Revenue, Orders, AOV, and Growth
- Dynamic region and category filtering with instant UI updates
- Interactive charts powered by a robust visualization layer
- Light and Dark theme support for optimal user experience
- Modular architecture built with modern Vanilla JavaScript patterns
Showcasing
The following sections highlight the core modules of SalesScope Analytics Dashboard, detailing the functionality and user experience delivered within each component of the application.
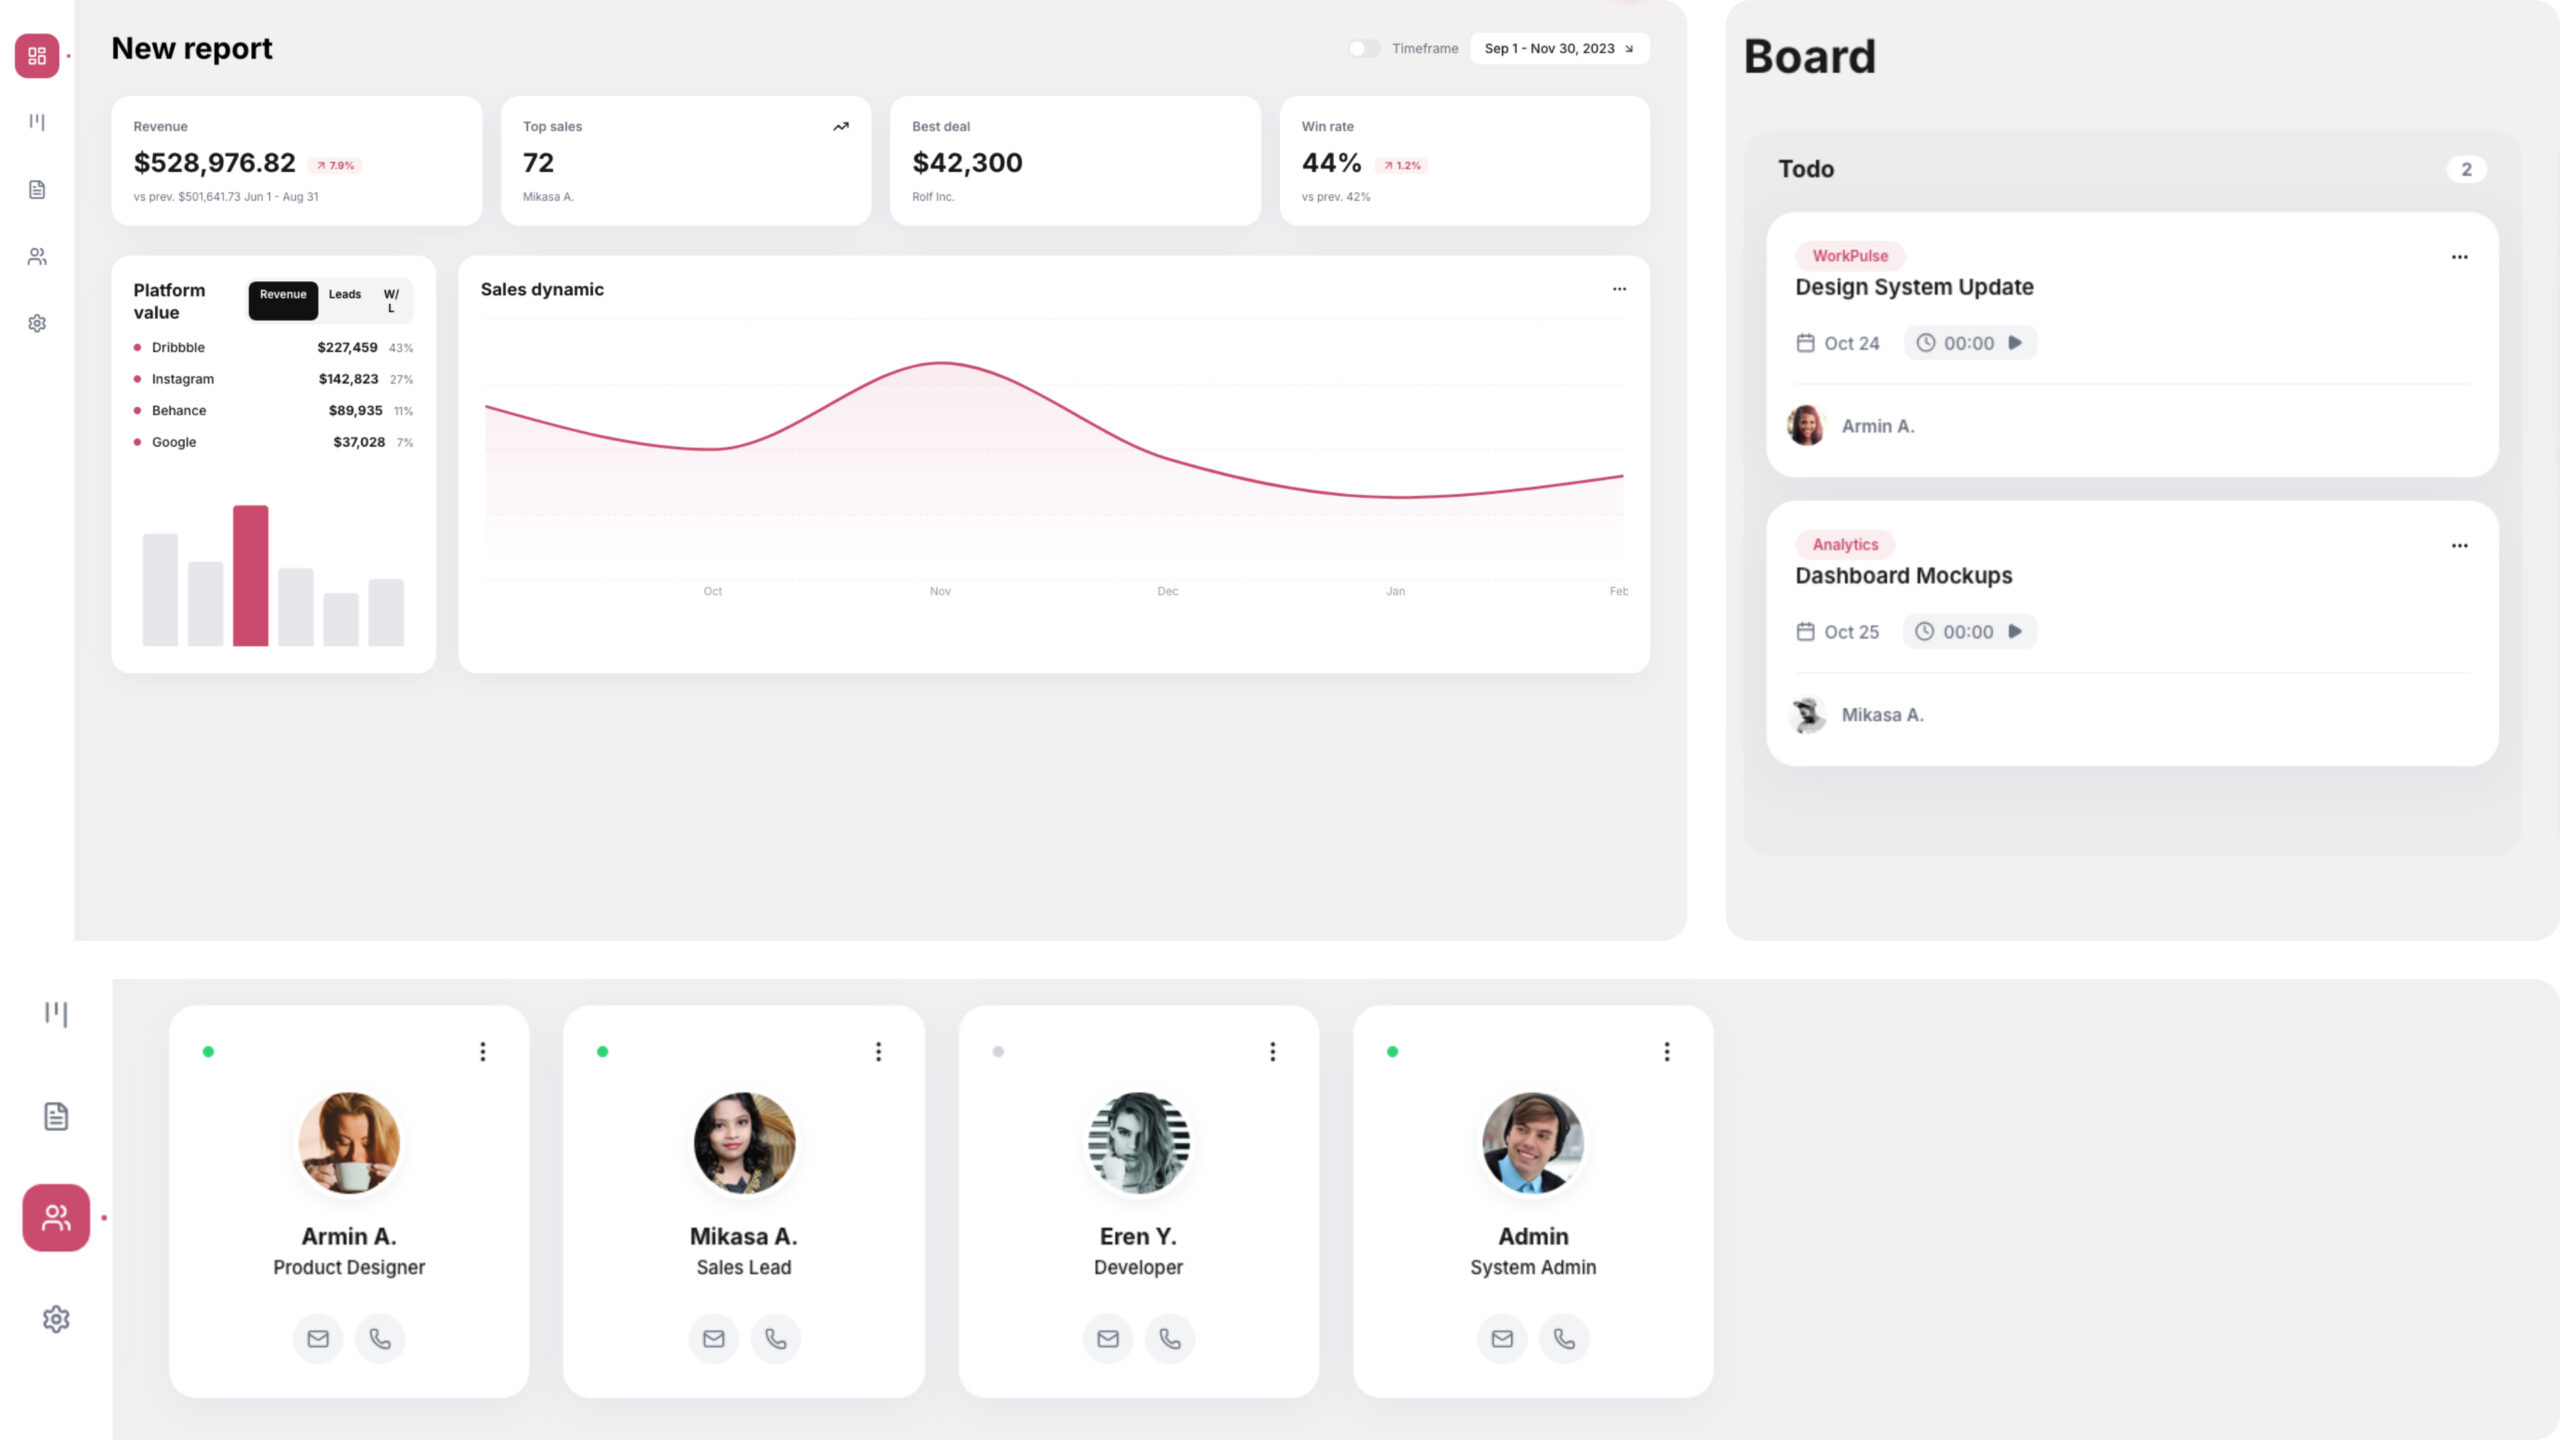
Dashboard Layout
The dashboard is structured into clearly defined sections, ensuring users can quickly interpret performance metrics and navigate insights without friction. Its semantic HTML5 foundation provides a scalable and maintainable structure.
- Top Bar with global filters (Date Range, Region, Category) and Theme Toggle
- KPI Section displaying core performance metrics
- Main Charts Grid for trend and category analysis
- Insights Panel generating contextual highlights automatically
Dynamic Filtering
SalesScope enables real-time filtering across multiple dimensions, ensuring that all charts, KPIs, and insights remain synchronized with selected criteria. This feature supports rapid analysis of specific markets or product segments.
- Region Filter to focus on geographic performance
- Category Filter to analyze specific product lines
- Date Range selector for time-based performance comparison
- Instant state synchronization between filters and UI components
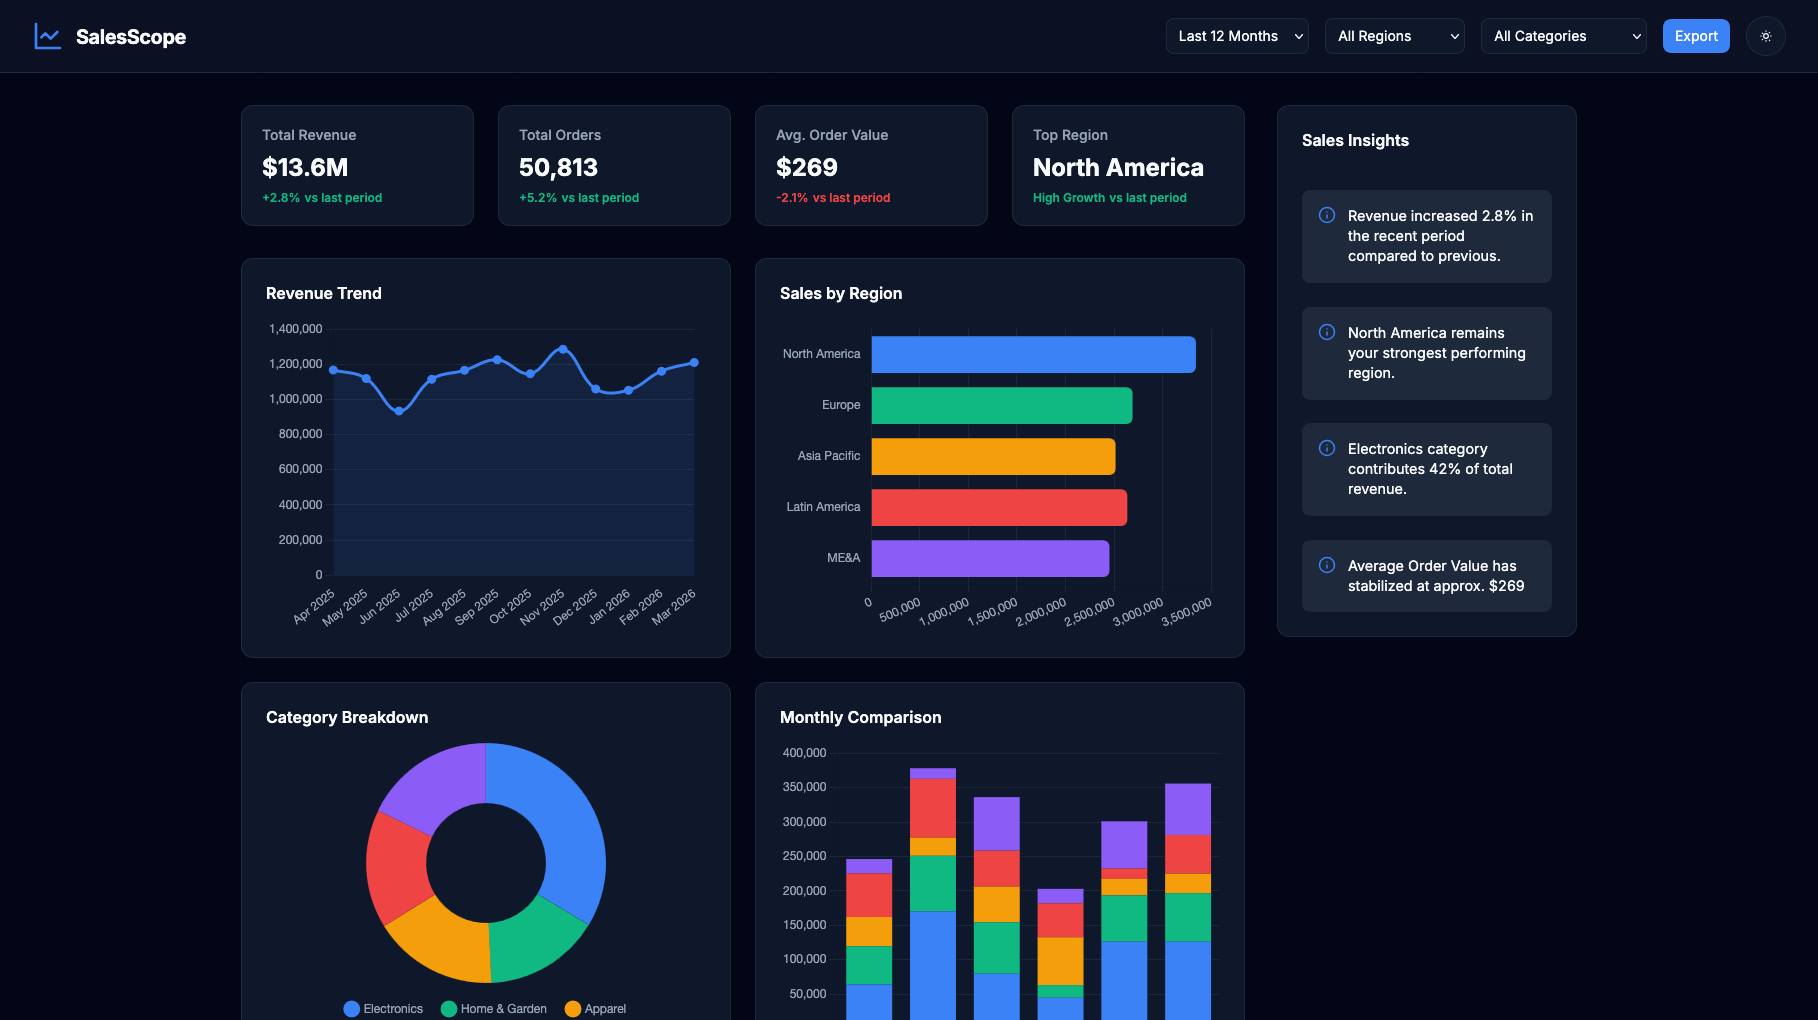
Interactive Data Visualizations
The visualization layer, powered by Chart.js, provides responsive and interactive charts that enhance data exploration. Users can hover over chart elements to access detailed contextual values and insights.
- Line charts for trend analysis over time
- Bar charts for categorical comparisons
- Tooltips displaying precise data values
- Adaptive chart styling for light and dark themes
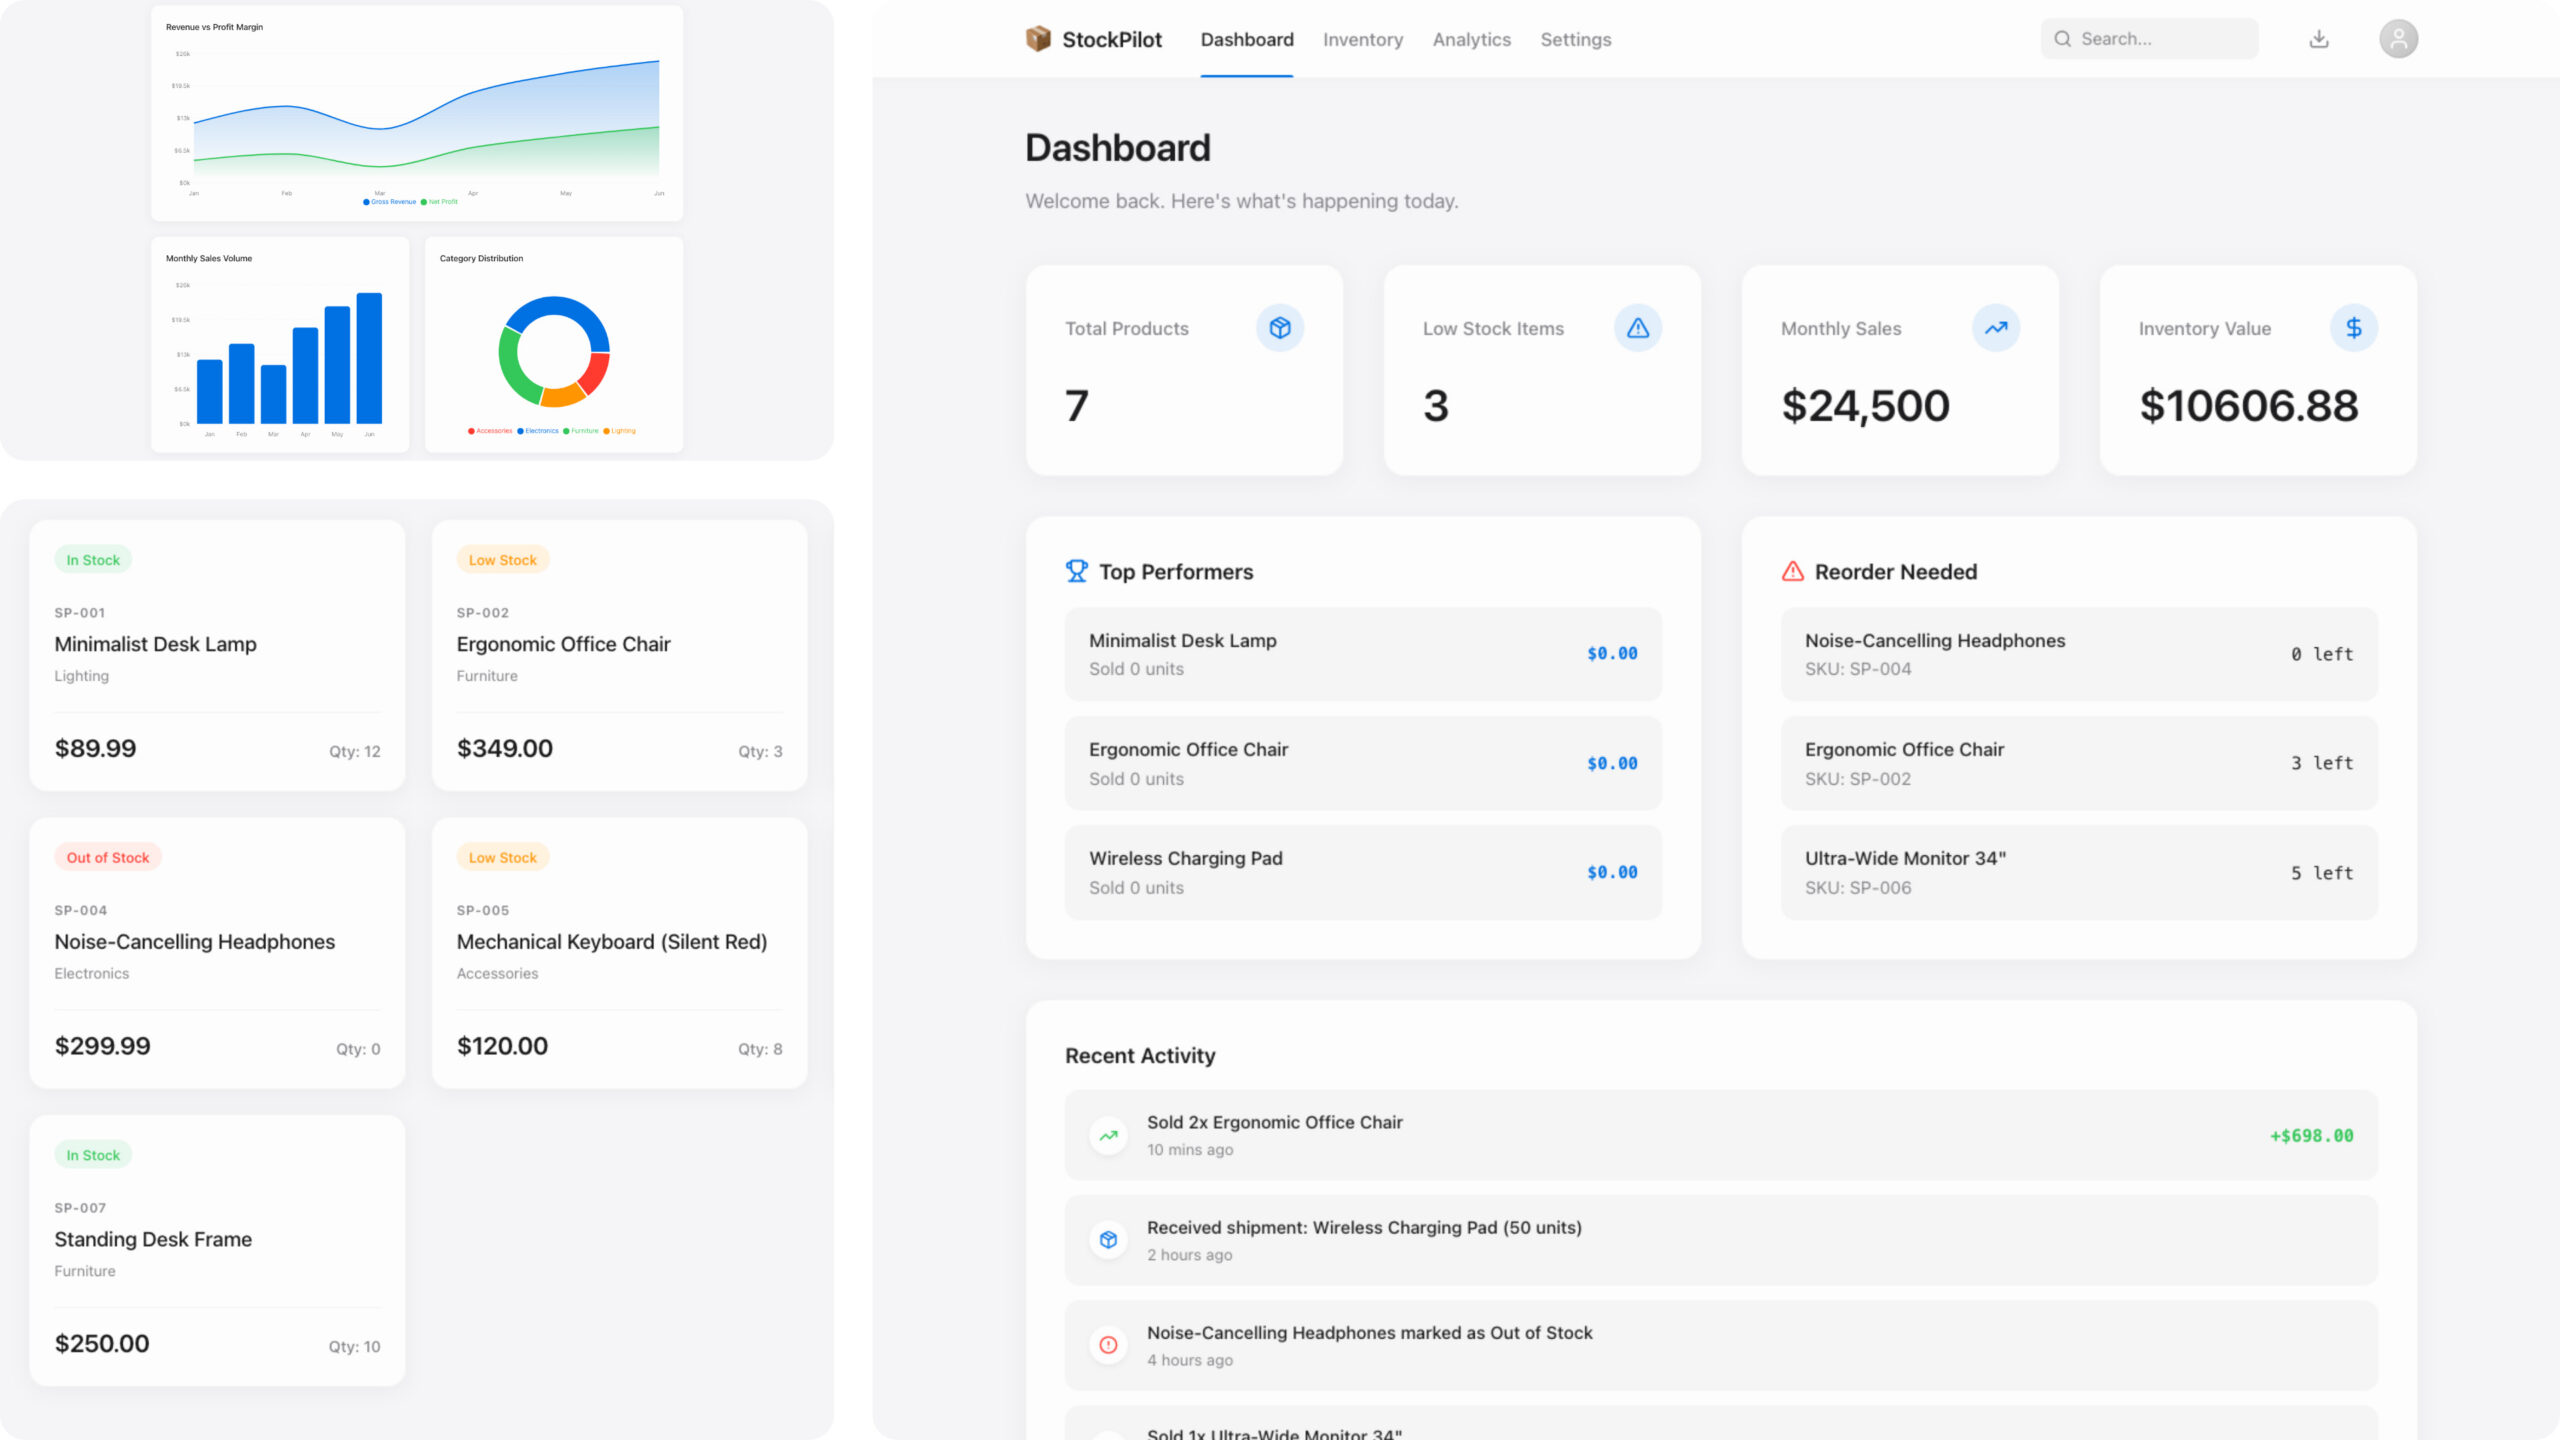
KPI & Insights Engine
The KPI and Insights module dynamically calculates and renders key metrics based on active filters. It translates complex datasets into concise performance indicators and automated highlights.
- Revenue, Orders, Average Order Value, and Growth tracking
- Auto-generated textual insights based on filtered data
- Real-time recalculation and UI updates
- Clean card-based UI components for quick interpretation
Theme System & Architecture
SalesScope features a scalable architecture designed for maintainability and performance. The design system leverages CSS Custom Properties for consistent theming, while modular JavaScript components ensure clean separation of concerns.
- Light and Dark theme toggle with full UI adaptation
- Modular structure: index.html, style.css, main.js, and src modules
- Data layer for mock generation and aggregation utilities
- Visualization encapsulation through a dedicated charts module
- Optimized development workflow using Vite